The bones of the earth; a new perspective
Mar. 21st, 2005 11:22 pmThe Shuttle Radar Topography Mission is one of the esoteric topics I'm most prone to enthuse about; I think of it as the last major donation made by the military-industrial complex to the sum of human knowledge before 9/11, and so possibly the last for some time. Using a fortnight of time on the Space Shuttle, Earth was mapped to 90-metre resolution in position and about one-metre in height.
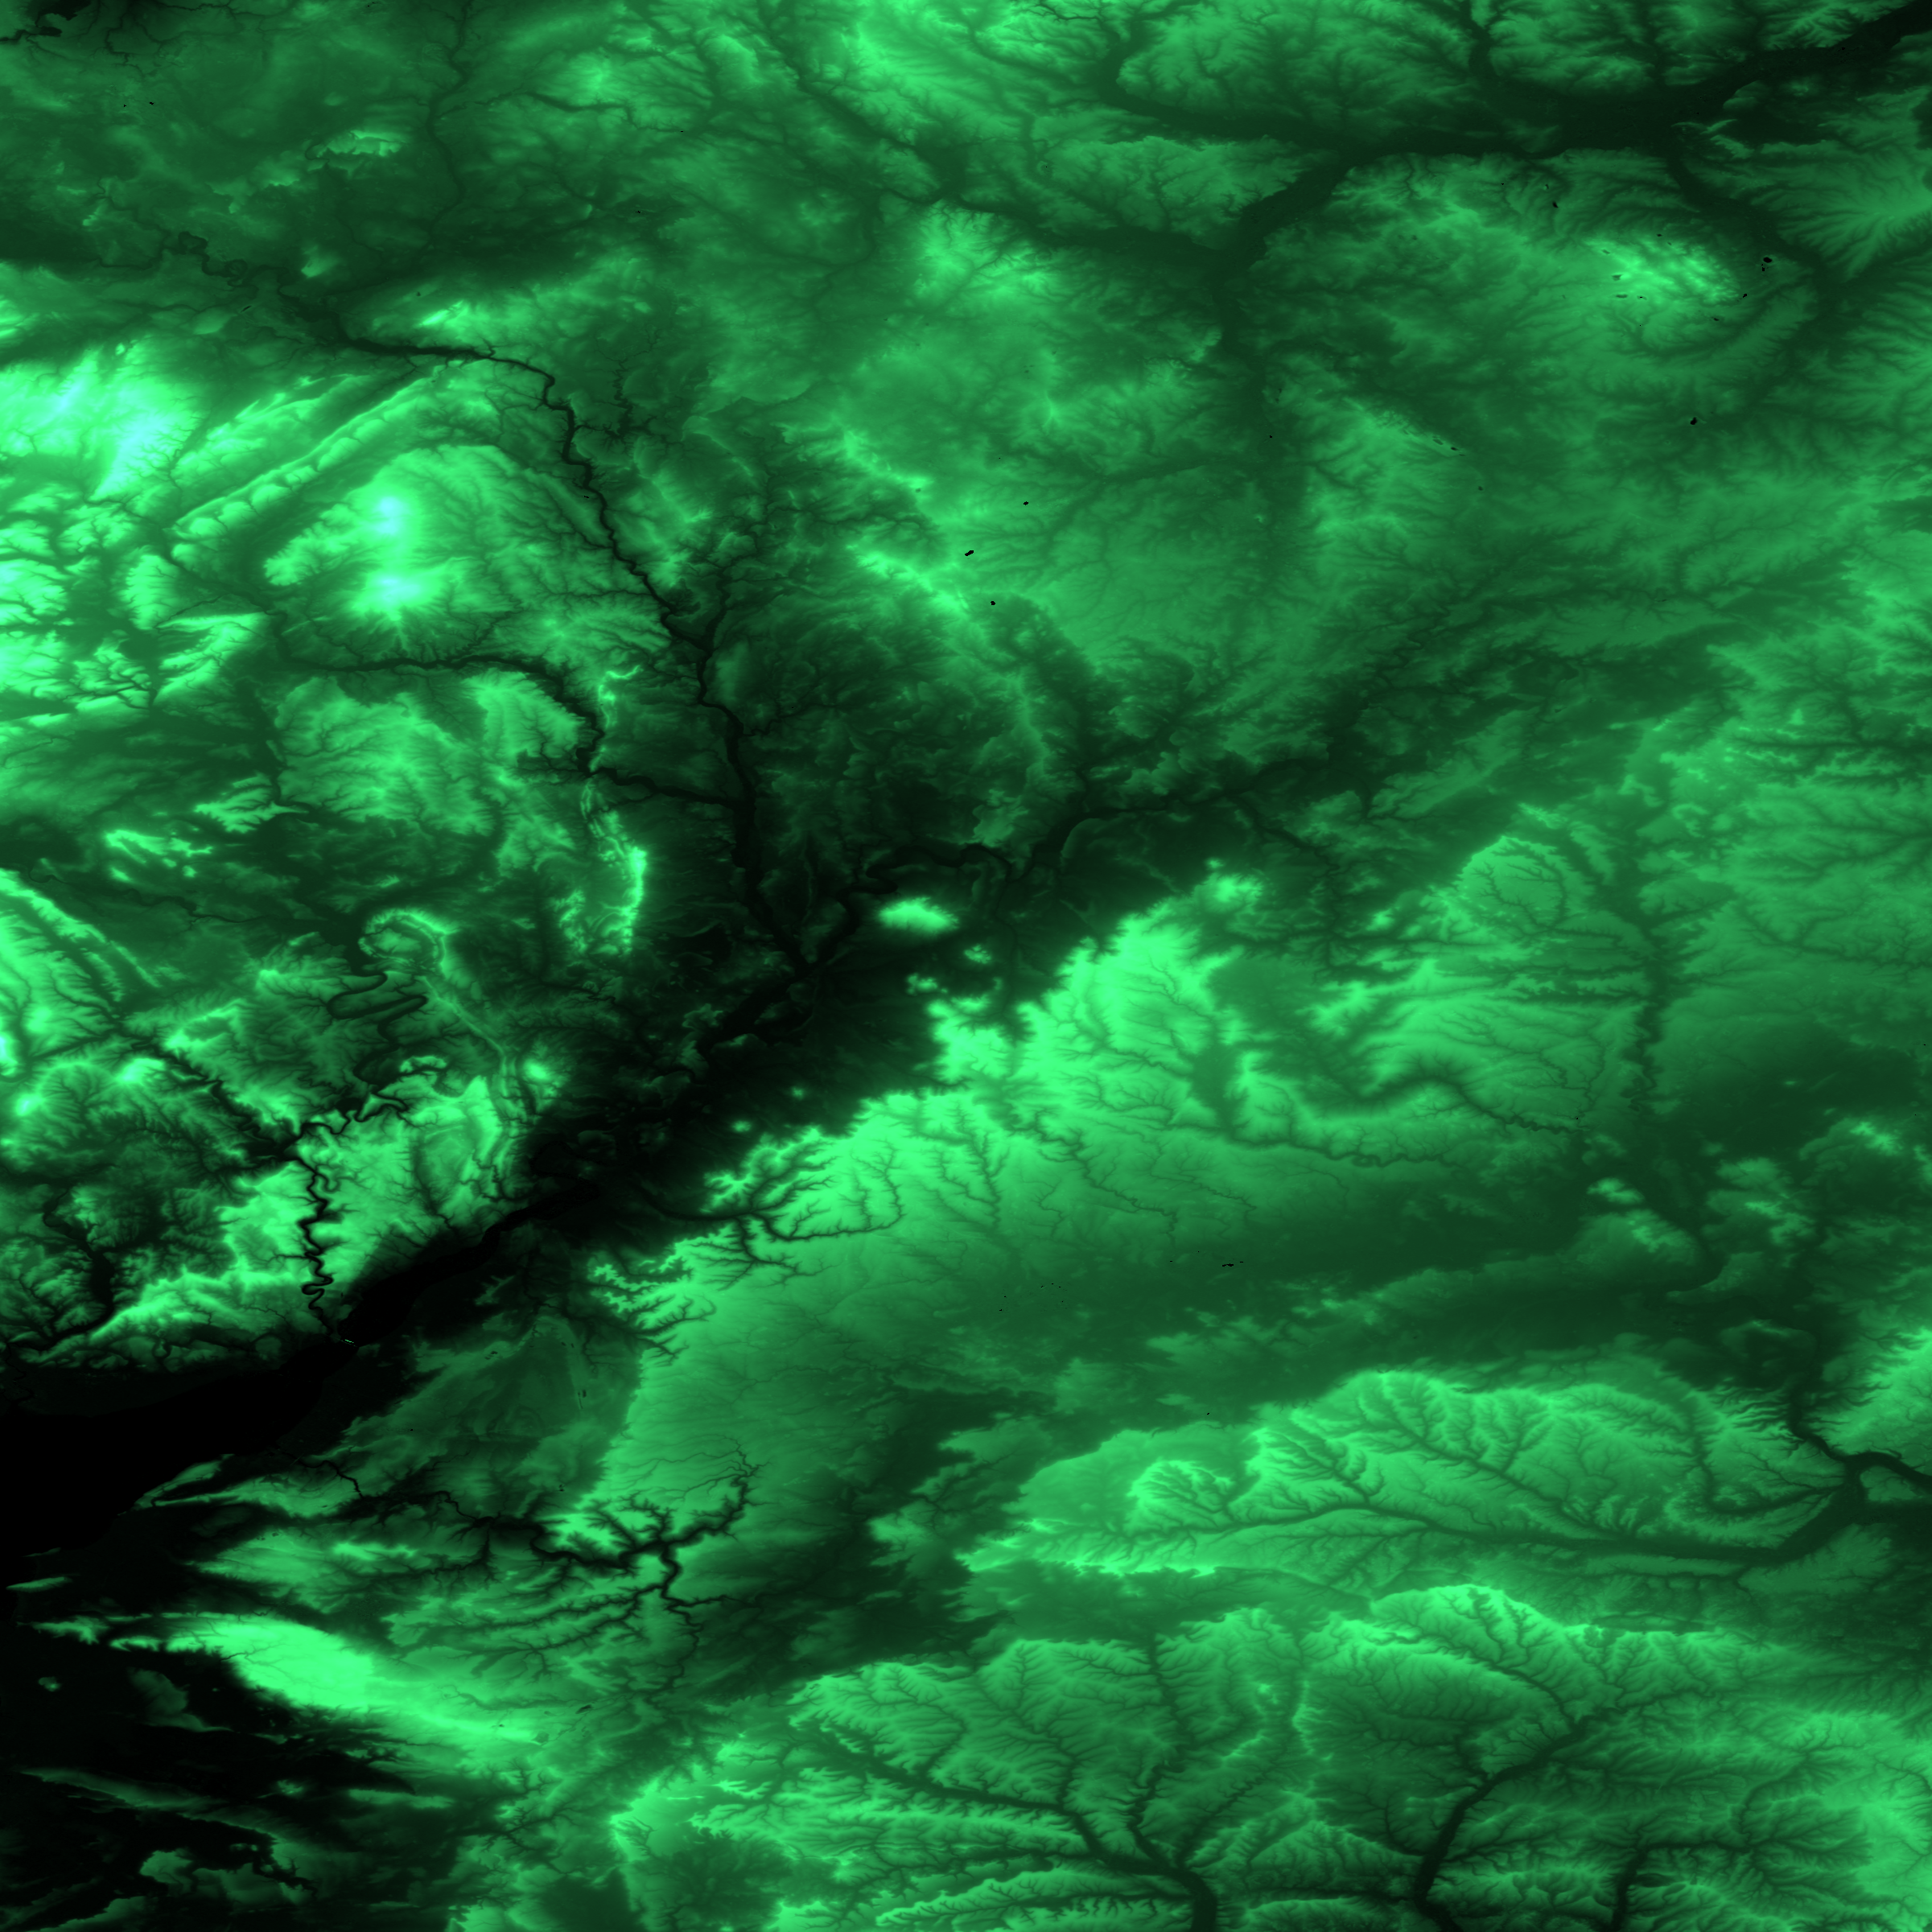
This is a very interesting resolution; water erosion is the main visible feature, you can see some of the moderate-scale processes of geology (are the long linear features dykes?), and you can't see humanity at all.
ESDI is the best interface to the data I've found so far, though it dispenses data in TIFF-format files, one square degree per file and one 32-bit float per pixel; these aren't viewable in standard software.
If you pull out hexdump, gcc, python and gimp in some order, however, you can get something like

I'll be very impressed if anyone knows the shape of my country well enough to be sure of where that is.
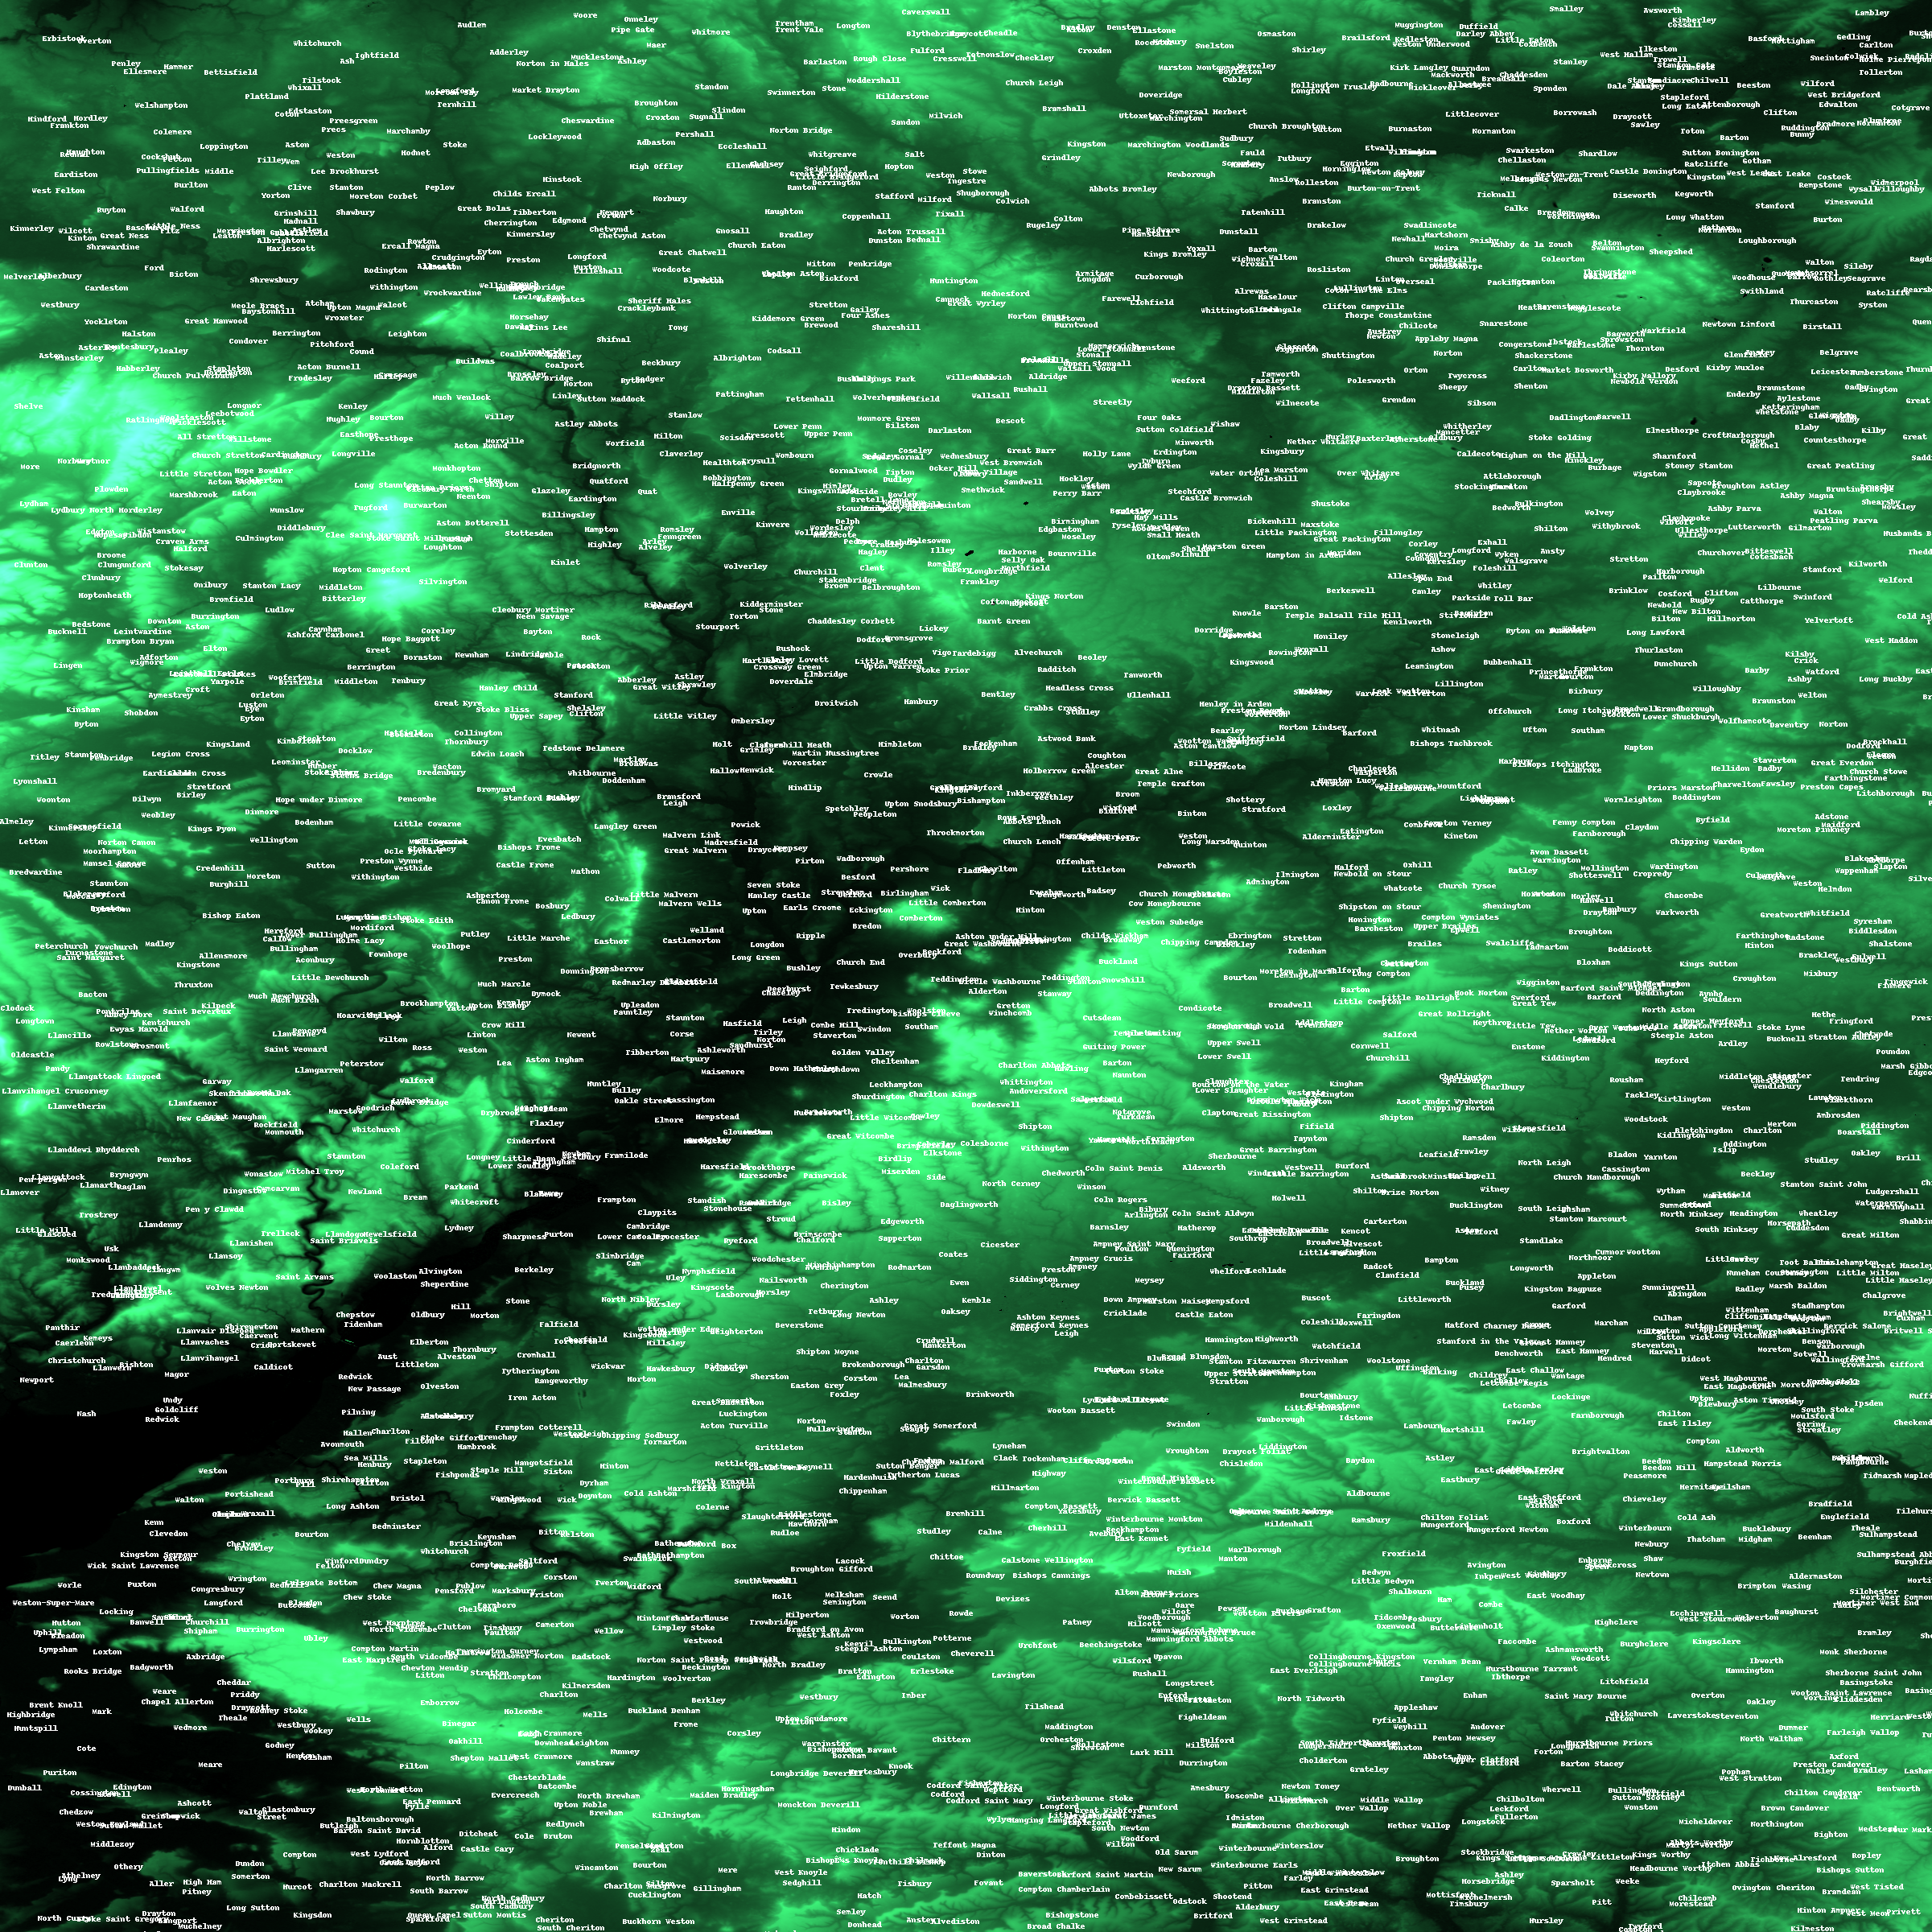
I've got a full-scale version (5MB .PNG) or a version with labels (5.5MB .PNG); I'd recommend downloading these to anyone with the connectivity. The labels come, I think, from a full dump of the National Geospatial Intelligence Agency's GNIS database; coordinates there are rounded to the arc-minute, which is about a mile, so I've positioned them randomly within a two-arc-minute square aroud the given position. This may mean North Wallop is positioned south of South Wallop; sorry.
If anyone's aware of a better freely-available gazetteer, please tell me.
This is a very interesting resolution; water erosion is the main visible feature, you can see some of the moderate-scale processes of geology (are the long linear features dykes?), and you can't see humanity at all.
ESDI is the best interface to the data I've found so far, though it dispenses data in TIFF-format files, one square degree per file and one 32-bit float per pixel; these aren't viewable in standard software.
If you pull out hexdump, gcc, python and gimp in some order, however, you can get something like
I'll be very impressed if anyone knows the shape of my country well enough to be sure of where that is.
I've got a full-scale version (5MB .PNG) or a version with labels (5.5MB .PNG); I'd recommend downloading these to anyone with the connectivity. The labels come, I think, from a full dump of the National Geospatial Intelligence Agency's GNIS database; coordinates there are rounded to the arc-minute, which is about a mile, so I've positioned them randomly within a two-arc-minute square aroud the given position. This may mean North Wallop is positioned south of South Wallop; sorry.
If anyone's aware of a better freely-available gazetteer, please tell me.
no subject
Date: 2005-03-21 11:50 pm (UTC)I initially wondered about the Southampton area but skew, but then decided it was the Severn estuary. Something about the angle of it. You'll have to trust me when I say that I only looked at the labelled version after that.
Oh, and I have managed to line up two browser tabs onto the same image such that I can turn the labels on and off just by switching between tabs. Which amuses me after a couple of glasses of wine.
no subject
Date: 2005-03-22 12:41 am (UTC)no subject
Date: 2005-03-22 01:22 am (UTC)no subject
Date: 2005-03-22 01:30 am (UTC)no subject
Date: 2005-03-22 04:48 am (UTC)no subject
Date: 2005-03-22 09:48 am (UTC)no subject
Date: 2005-03-22 10:33 am (UTC)I don't have the software to distribute, but I've got the capability
Date: 2005-03-22 08:21 pm (UTC)At the geological level, this large image (http://www.chiark.greenend.org.uk/~twomack/goo.jpg) is obtained by flood-filling with blue everything connected by a path below 57m to the sea. It's clearly fiction; you don't get islands with that low relief and a sea-bed going down that shallowly, but I don't know where I'd begin in simulating wave erosion. It might be more accurate in the regions beyond the straits of Bath and of Llandogo, where the waves won't penetrate.
The two islands sticking up by the Cheltenham escarpment are the two hills of Gloucester; the limits of the water in the north-east are Kenilworth and Offchurch, in the north-west it flows under Ironbridge and Stoke becomes a harbour town. Chippenham is the little island in the south-east part of the sea; the straits drown Bath. Chipping Sodbury and parts of Filton survive, and there's an isthmus with Portishead on it. I'm afraid Bristol's gone.
The labelled wet image (5M PNG) (http://www.chiark.greenend.org.uk/~twomack/wet-labelled.png)
no subject
Date: 2005-03-22 08:22 am (UTC)Perhaps of more interest are the strangely regular and non-fractal series of squashed spheres towards the top left of the image. Part of the South Wales Large Hadron Collider, perhaps?
no subject
Date: 2005-03-22 08:51 pm (UTC)But I am more ignorant of geography than a worm is of wind-surfing. I've pointed Tim Bond, a geologist at ICL (OK, specialising more in Venus than in Earth at the moment, but one presumably trains long on Earth before proceeding outwards) at this page, and expect him to post something amazingly clear and vastly erudite.